Showing posts with label mstr. Show all posts

Wednesday, June 26, 2013

Subtotal From Base


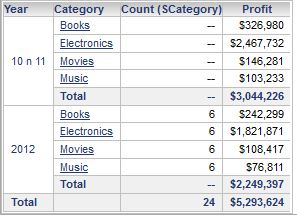
Lets look at this report. This report has a metric defined as distinct count of subcategory. Do you find anything strange in this report ?


Yes, the grand total is 24 and not the sum 24 for three years. (72) . Here the count is a distinct records and is defined as Count(Subcategory){~+}

The subcategory for each of the Category have not changed in 3 years. Hence the count of distinct subcategory is 24. Finding a total for distinct count was not possible untill MicroStrategy version 9.3. With version 9.3 this is possible by a new feature called subtotal from base. You have to create this from the web as a derived metric by right click on an attribute. 

The distinct values cannot be reaggregated to higher levels, you have to aggregate it from the base level to get the correct count of distinct values. When used in a view report, the Cube Subsetting Instruction Engine generates the appropriate sql to calculate this distint count from the base level.

However you will not see the distinct count when you use a derived element. This is becase the derived element is calculated by analytical engine and it runs after CSI engine. Hence the data will be wrong, since analytical engine is not re aggregating using the base values. So instead of displaying wrong number, mstr would show "--" .  For example your report will look like below with derived element.


You will see similar results when you apply a metric limit, this is also because the metric limit is applied by the analutical engine after the CSI engine execution. 

VLDB Settings For Temporary Tables


Temporary tables are needed by MicroStrategy to store intermediate data.  You can choose the table type and kind using the VLDB properties.

Derived Tables

This is a nested select statement, and it does not physically exist. It is created during the execution of the sql and it utilize the database memory for creating this virtual table.  This makes use of the database memory, and you will need to check the performance by testing both types.

The syntax is like select a,b from (select c,d from table)

You might have noticed that certain reports cannot be resolved by the use of subquery in derived tables. These reports include the following.
  1. Creation of datamarts
  2. Query partitioned tables
  3. Reports with Custom Groups
  4. Reports with Percentage Ranking
  5. Reoprts with analytical functions supported by MicroStrategy Analytical Engine and not the Database

Common Table Expression

example SQL .

with TEMP1 as
(select a21.STORE_NBR STORE_NBR,
(sum(a21.REG_SLS_DLR) + sum(a21.PML_SLS_DLR)) TOT_SLS_STR,
sum(a21.PML_SLS_DLR) PRO_STR
from STORE_DIVISION a21
where a21.STORE_NBR = 1
group by a21.STORE_NBR),
TEMP2 as
(select a22.REGION_NBR REGION_NBR, ............

The advantage here is that you can create the temp table once and refer it multiple times.

You can change the table type using the VLDB Property ->  Tables -> Intermediate Table Type .

Implicit Table creation Vs. Explicit Table creation.

Example of Implicit table creation
create table TEMP1 as
select a21.STORE_NBR STORE_NBR,
(sum(a21.REG_SLS_DLR) + sum(a21.PML_SLS_DLR)) TOT_SLS,
sum(a21.PML_SLS_DLR) PROMO_SLS
from STORE_DIVISION a21
where a21.STORE_NBR = 1
group by a21.STORE_NBR

Example of Explicit table creation
create table TEMP1 (
STORE_NBR INTEGER,
TOT_SLS DOUBLE,
PROMO_SLS DOUBLE)
insert into TEMP1
select a21.STORE_NBR STORE_NBR,
(sum(a21.REG_SLS_DLR) + sum(a21.PML_SLS_DLR)) TOT_SLS,
sum(a21.PML_SLS_DLR) PROMO_SLS
from STORE_DIVISION a21
where a21.STORE_NBR = 1
group by a21.STORE_NBR


You need to test and find out which of these methods provides an optimal performance. Generally there is not much difference in the excution plan between these two types, (I have not lab tested this), however  according to Dr. Tim Hall   implicit cursor is kind of faster.

You can access this setting at VLDB ->  Tables -> Table Creation Type

Another setting you might be interested to check would be "Drop Temp Table Method" . Certain cases when you use global temporary tables on Oracle, the tables need to be empty before you can drop it. Otherwise oracle will throw error.

MicroChart


Its is just a quick reference to build the microchart. I just copied the contentd from the help page.

To display all three microcharts, place at least seven metrics on the Grid/Graph’s columns.

The first (left-most) metric on the columns determines the height of the bars in the bar microcharts and the peak points in the sparkline microcharts.

The second metric creates the horizontal reference lines that are displayed in the sparkline microcharts.

The third metric determines the length of the performance measure bar in the bullet microcharts. The bar represents the actual metric value.

The fourth metric determines the maximum possible values in the bullet microcharts.

The fifth metric determines the right-most boundary of the first color band, Band 1, in the bullet microcharts.

The sixth metric determines the right-most boundary of the second color band, Band 2, in the bullet microcharts.

The seventh metric determines the value of the vertical reference line in the bullet microcharts, which is typically the target value for the metric.

Any additional metrics are displayed in the columns of the widget, after the microcharts and their associated metrics.

For KPI List mode, you must place at least one metric on the Grid/Graph's columns.
By default, each metric is calculated and displayed as an individual row in the widget.

To display all three microcharts (bar, sparkline, and bullet), you must place a total of at least seven metrics on the columns as described above. You must also set the number of metrics used to calculate each row in the Metrics per KPI field to seven or greater in the Microchart properties dialog box.
 

Concatenate Two Attribute Forms


You can create a new derived metric from an existing metric in the grid. And you can use many of the available function in the derived metric editor. Ist is possible to concatenate two attribute forms using derived metric.  Derived metrics will by default show only the metrics available in the grid.

For example. I have a rerport with the below attributes.


However I need to display the combination of  two attributes forms as below.ie. ID of category and DESC of subcategory.


You can use concat function to join multiple strings. So you need to convert the attribute form into derived metric and then use the concat function. How do we do this ? You can use MAX function to convert the atribute form into a derived metric, so that concat function can recognise the string.  So inset a new metric with the below formulae.

Concat(Max(Category){~}," . ",Max(Subcategory@DESC){~})

This is concatenating the ID form from category with a space dot and decriton form from subcategory.

Now, in my report I am showing all these three columns, ie category, subcategory and categotyID . SubcategoryDESC. How do I display only the concatenated attribute? If I remove the other two attributes from the grid, the derived metric will be empty. Do you have any suggestions other than modifying the width of the the attributes ? Please do let me know.


Microstrategy Project Default Homepage

At my previous project, we had a requirement to showcase a dashboard on a TV. It used a specific username and we did not want to go through shared folder for accessing the dashboard every time we login. So we had to make this dashbaord a default home page. You might be familiar in setting this in Mobile config. However you can do that in web also.

  1. execute the document you want to set up as the default page.
  2. click on the mstrLogo (red star image on top left) and choose preference.
  3. In user preference - > general you will see an option to set up the last executed document / report as the default start page.
  4. So next time you only need to login and you will see your dashbaord executed.

Thursday, June 20, 2013

Passing Prompt Answers in URL


At least couple of times in your project, you might have come across a situation where you need to share a view of your dashbaord or report, based on the prompts that you selected. Fortunately, MicroStrategy supports and provide a way to pass the prompt answers in the URL, So that you can generate the URL and share it with other or you can even use it for stress testing. 

There are few types of Prompts and the parameter for each of these are different.

Prompt Type                                      Parameter
Element list Prompt                              elementsPromptAnswers

Value Prompt                                      valuePromptAnswers

Object Prompt                                    objectsPromptAnswers


Unfortunately i did not see a method for passing  a level prompt in the URL 

Now that we know the parameter for different prompts, lets see how to pass values to these prompts.

  • elementsPromptAnswers
    • AttributeID;AttributeElementID^DisplayName is the formart
    • AttributeID;AttributeElementID^DisplayName;AttributeElementID^DisplayName  --. when you have multiple answer for a prompt. 
    • AttributeID;AttributeElementID^DisplayName;AttributeElementID^DisplayName,AttributeID;AttributeElementID^DisplayName when you have multiple prompts.
  • valuePromptAnswers
    •  Unlike the element prompt, here there is no option to refer to the attribute. Hence the order in which you give the prompt answers will impact the results. If one of the answer is empty, you need to properly delimit that.
    • user carat "^" for delimitation. eg: Books^2013^India . If you dont answer 2013, the format will be Books^^India
  • objectsPromptAnswers
    • The name in the below format is optinal, but without that you will not be able to refer to the prompt in the document. Also since the prompt answers do not have identifiers to map then to prompts, the order in which the prompt is answered is important. 
    • objectID~type~name is the format 
    • objectID1b~type1b~name1b^objectID2a~type2a~name2a  -> multiple objects prompts answered.
    • objectID1a~type1a~name1a%1BobjectID1b~type1b~name1b  -> passing multiple objects in one prompt.
You can find the objectID either from the metadata or more easily from the desktop. Right click and check the property.

Now lets look at constructing the URL.

For a Dashboard, URL is

http://Localhost:8080/MicroStrategy/servlet/mstrWeb?

evt=2048001
&src=mstrWeb.2048001
&documentID=
&ViewMedia=2
&elementsPromptAnswers=

For a Report, URL is
http://localhost:8080/MicroStrategy/servlet/mstrWeb?

&src=mstrWeb.4001
&evt=4001
&reportID=
&elementsPromptAnswers=

Notice the highlighted changes in event number and document / report ID.

Lets look at an example. I have a document with a report, and it has all the below types of prompts. It has object prompt, element prompt. 
Objects          -> attr - category / brand / call center
                      -> metric - profit / revenue
elmemt list      -> limited on the year

How do I add the elments and objects to the url  ? We can follow the method described above. But it becomes tedious and error prone when the number of elements and objects increase. What is the best way to create the url in this case ?

Fortunately, MSTR also supports passing prompts as XML. Now how do we generate an XML. It is Quiet easy.  Just place a dynamic text box in your document for {&PROMPTXML} .


Execute your document and you will see the XML.


You can now insert the xml using the parameter promptsAnswerXML in the URL.


Wednesday, June 5, 2013

9.3 Parallel Query Execution


9.3 Supports parallel SQL execution from reports. 


There is another setting with database instance manager where you can set the maximum number of parallel execution of sql, this is for sql from different reports. you will need this while executing a document.  We are here looking at executing the sql from a single report in parallel.

You can enable / disable this through the VLDB settings. Go to VLDB - Tools - Show Advanced Options.  In Query optimization, you can find the below two properties.


The second one can help you get an estimation on the time that can be saved with parallel execution. This information will be shown in the report SQL.

for example.

WITHOUT PARALLEL EXECUTION
Query Generation Time: 0:00:00.26

Total Elapsed Time in Query Engine: 0:04:17.49
Sum of Query Execution Time: 0:04:13.07
Sum of Data Fetching and Processing Time: 0:00:00.05
Sum of Data Transfer from Datasource(s) Time: 0:00:00.05
Sum of Analytical Processing Time: 0:00:00.00
Sum of Other Processing Time: 0:00:04.37
Projected execution time improvement (%) if executed in Parallel Execution mode: 97%

This report that took about four minutes to run, can be improved upto 97% using PSE. (Parallel SQL Execution)   WITH PARALLEL EXECUTION Query Generation Time: 0:00:00.30
Total Elapsed Time in Query Engine*: 0:02:42.19
Sum of Query Execution Time: 0:05:12.80
Sum of Data Fetching and Processing Time: 0:00:00.01
Sum of Data Transfer from Datasource(s) Time: 0:00:00.01
Sum of Analytical Processing Time: 0:00:00.00
Sum of Other Processing Time: 0:01:47.28

* This report has some passes that have been executed in parallel. Individual time components may not add up to Total Elapsed Time in Query Engine.

I can see that this report not runs at 63% of the time it took earlier withouit PSE. But why did not I get 97% improvement ? You can configure the number of PSE for your report from Project Configuration - Advanced - VLDB setting - Query Optimization.  By default it is 2. Ie two sql pass will run in parallel. Try playing with this number and see what is the best value for your report.   In my case, I had about 206 SQL pass, and when set PSE to 3, I started getting errors, may be the SQL pass was fired too fast, even before the DB commited the table from the previous passes.   This is a project wide setting. In your project, if you have 5 reports and each of them have a different optimal number for PSE, you need to choose the lowest PSE for your project. By optimal PSE settig I am refereing to the max PSE you can choose, before the report starts failing. (too fast - just like some movie heros shoot the enemy faster than their own shadows :-) ) .       

Friday, May 24, 2013

MicroStrategy Technical Notes.


Its a collection of TN for quick reference.

TN:18911 - Remove SQL information in the report details in web 

TN:30699 - Measure Intelligent Cube performance

TN:19864 - How filter objects are resolved

TN:9434  - Remove redundant where clause using report as filter

TN:19861 - Logic for multipass SQL generation.

TN:19233 - Retrieve ID and DESC in two different pass

TN:19866 - SQL Join tree construction logic

TN:8159  - How does mstr join tables?

TN:7494 - Table join order

TN:11721 - settings to consider when performing outer join

TN:16423 - different branches in sql

TN:20579 - Global optimization sql pass with different where clause

TN:11122 - Downward outer join

TN:20062 - Report Limit vs MQ

TN:4295  - Intermediate table naming convention

TN:15393 - Partial Star Join

TN:11067 - Adaptive Metric

TN:20017 - Join on common attributes when no common key can be found.

TN:8831 - Filter defintions are stored based on the ID of the attribute

TN:17415 - remove coalesce function by removing outer join support

TN:19863 - How M-M relation is resolved?

TN:7956  - multipass sql even when the fact can be calculated from the same fact table.

TN:13508 - Global optimization remove unused sql

TN:14562 - Relationship filter to avoid expensive subquery

TN:6005 - Fact dependent security filter

TN:11351 - different security filters for different facts based on user login.

TN:10138  - WS, RI, HL

TN:38391  - Configure certificate server for Mobile

TN:34911 - Display group by as wheel in ipad

TN:14878 - Enable Web Beans tracing in MicroStrategy Web 9.x

TN:41346 - DS Bursting feature

TN:43665 - Integration with R


Report Details - Query Execution Time.

You can find the details of report execution and SQL in the SQL view. Starting from version 9.2.1 you can see the below information.

Total Duration in Query Engine -  This gives you the total time the system took in the data query phase. Its is a sum of all the below  four.

SQL Generation -  The first step is to generate an SQL that needs to be run against the WH. This show the time taken by the engine to generate the SQL.

SQL Execution -  This is the time the SQL query took to run against the WH.

Total Data Fetch Duration -  Once the SQL is run, the data needs to be send back to the Iserver. This show the time it takes for the data to reach Iserver from the WH. If you see huge delay here, check your network

Other Processing Duration in Query Engine -  The results that come from the WH needs to be loaded into the Iserver memory, and in a format that Analytical engine can process if needed. This also includes the time needed for Analytical Engine calculations.

Wednesday, May 22, 2013

Dynamic Secury Filter


When I say dynamically apply the security filter, I am not talking about having multiple securty filters and dynamically choosing the filter on user login.  Lets look at this example. I have ten region, and each region has one manager. I want to allow each manager to view the data for his region. Only his region. 

You can either make use of database level security feature, by mapping user connections. If data for all the regions are in the same table, you can still apply row level security. How do we apply this security filter from MSTR ?

You can create 10 different security filters, and add it to each region manager. In case if you are going to have new manager for these region, you can create 10 user group and apply security filter to these user groups. This is a failry easy example. Now my region grew and I have now 100 regions defined. How we apply the security filter ? Create 100 different security filters and groups. God, I am going home.. 

Its not practical to handle this situation like this.  You can make use of system prompt, [User Login] and database tables, to make this work easy. You will need to create a table. You need to be careful with the columns. Since in this case you are going to create a filter on Region for each region manager, you need to create a table with Columns for Region attribute ID and a new attribute for User (USER_ID, USER_DESC).

If your requirement is to create a filter based on country, in the new table should contain the  ID column for Country attribute and user attribute.  If your region id is mapping to REGION_ID, you creare the column name as REGION_ID. This way you do not want yo remap the ID form of Region attribute to the column in the new table.

We want this table to me joined in the SQL and for a correct sql join tree, it is important to define the relationship between User and Region. You create the attribute on wchich you want to filter on as a child of user. So in this case the relationship between user and region is one to many children. One user can have one or more region.

Now you can create an security filter as User@DESC = ?[User Login] . Note that you have to filter user attribute on DESC and match exactly to a custom value as "?[User Login]" . You might not be able to drag drop the system prompt. Dont worry about it.

Assign this security filter on the user groups. Now update the table that you created in the database with values for Region manager, based on his user login and the region to which he has access.  Compared to creating n number of security filters and assigning it to user, updating the DB is easy.

Example security table.

USER_ID USER_DESC REGION_ID

1 sam 1
2 nam 2
3 Administrator 3
1 sam 3
3 Administrator 1

Look at the SQL when you execute an report. You will see the security filter applied on the WHERE clause.

truncated..................
where a11.[CALL_CTR_ID] = a12.[CALL_CTR_ID] and

a12.[REGION_ID] = a13.[REGION_ID] and --> selects only the region available in the security table
a12.[REGION_ID] = a14.[REGION_ID]
and a13.[USER_DESC] = 'sam--> Gets the value from the system prompt,

Lets add some complexity to this.  

I want each Regional manager to see the data for his region and also the total for the Country to which his region belongs.

You want the metric at the country level, how do you do this ? Using a level metric we can calculate the metric at other level that that of Report Level. In this case it is Country.  How to we include all the regions in this country ?  By making the filtering as absolute.  So you create a metric with level country and filtering to absolute and grouping as standard.  This level metric will give you the total for the county in which the region belongs

If you look at the SQL you will see the below statement selecting the country for which the logged in user's region belongs to.

select distinct s22.[COUNTRY_ID] AS COUNTRY_ID

from [LU_REGION] s22,
[SECURITY] s23
where s22.[REGION_ID] = s23.[REGION_ID]
and s23.[USER_DESC] = 'sam'

Monday, May 20, 2013

Modifying column names


Sometimes in your projects you might need to accomodate a change in table column names. The process earlier was to manually unlink the dependent attributes, and then update the table structure using the WH catalog. Thanks to Architect tool, the process is much simpler now. I have three tables and in one of the table, the ID form for Attribute A1 is pointing to column A11. This column is changed to columan name A1.
The below is the screen shot of the changes that needs to be done using Architect.

Open the Architect from Schema menu, and go to table view.
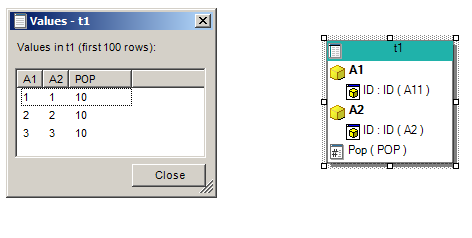
Right click on the table and show data. You will see that the column name has changed.


Right click on the table and update structure. You will see the new table as below. A1 is the new column name.

Now you need to modify the definition of A1 attribute to include this change.


In my project attribute A1 has multiple ID forms. This is why you are seeing two definitions. . I want to remove A11 since column name A11 does not exist anymore and i dont reference it in any other tables.


You cannot just choose the defnition for A1 column without deleting / removing A11 definition.


Once you are done, go to hierarchy view. You will see that the relationship is broken


Click on A2 and frag a line pointint to A1. The Architect will create the relationship between these two attributes.
Save and update scema and you are done :)

Friday, May 17, 2013

MicroStrategy SQL Generation


How does MicroStrategy generates an SQL?

You must first understand that no BI systems are build on artificial intelligence, and that they will start auto learning. These systems works on a predefined set of rules. Objects are built on that, and sql are generated in a predefined fashion. 

MicroStrategy identifies tables as base table and lookup table. Base tables support the calculation and aggregation of metrics, and the lookup tables are for resolving the attribute forms.

When you run a report, MSTR looks for the best base table that can support the calculation of the metric in the report. It also checks whether the dimensionality attributes for the report are included in the base table.  In most cases you are not likely to keep all the dimensionality in the base table. In this case engine will still choose the base table provided, the base table has the child attribute of the report dimensionality.  If there is no child attribute of the dimensionality included in the report, engine will still support the base table if there is a fact extension defined.  Sometimes, it so happens that in your data warehouse, you have multiple tables that can support the attributes and metric. In that, MSTR looks for the logical table size, and it chooses the table with the smallest logical table size.

Let's look at how the lookup tables are joined the SQL. You will see that in most cases, only the ID form is included in the intermediate pass. If you have included parent and child, only the child ID form will be used in the SQL. MSTR will not join an extra table for the sake of resolving the extra forms, it includes the extra forms only if they are present in the tables included in the SQL pass.  All the other forms that are not yet resolved will be obtained from the final pass by using the lookup tables.

Lets look at the below example. I have three tables in my WH.

Table T1

Table T2

Table T3


The relationship between the attributes is shown below.
I am trying to generate a result at level B2.


The SQL that I need to use for generating this out is
#mysql> SELECT T2.B2, COUNT(T1.POP), SUM(T3.POP2) FROM T1, T2, T3 WHERE T3.A1=T1.
A1 AND T1.A2=T2.A2 GROUP BY T2.B2;

Will you be able to generate the same results in MSTR ? By the rule, it needs to have the dimensionality included in the base table, in this case it is B2, and it does not exist in the Fact table T3,  Not it checks whether any child of B2 is available in the Fact table T3, and it does not find anything. Hence this will result in a cross join between the Fact Table T3 and  table T2 (which has the required dimensionality). 

The SQL generated by MSTR will have a cross join.

select pa11.B2 B2,
pa11.WJXBFS1 WJXBFS1,
pa12.WJXBFS1 WJXBFS2
from (select a12.B2 B2,
        count(a11.POP) WJXBFS1
        from t1 a11
        join t2 a12
        on (a11.A2 = a12.A2)
        group by a12.B2
) pa11
join (select a12.B2 B2,
        sum(a11.POP2) WJXBFS1
        from t3 a11
        cross join t2 a12
        group by a12.B2
) pa12
on (pa11.B2 = pa12.B2)

The report data is abviously wrong in this case due to the cross join.


What can you do to fix this report ?

We are talking about fixing this report, so that we get correct results. So I will not look at adding the child attributes into the report, so that the dimensionality gets changed. What changes do we need to make to the base table, so that the calculation of this report is supported.  The base table in this case is T3. and it has an attribute A1. If you want to do the calculation at level B1, you need to make A1 as a child of B1. So you will need to either modity T2 and add A1, or create a seperate relationship table for A1,B2.
 
What other options do you see..

The relation ship was designed like this.


Correct the relationship as below.


Thursday, May 16, 2013

Load testing Microstrategy Web Reports and Documents

Load testing web

In almost every project, the architects will need to publish the repornse time of ther BI systems. To get the response time from the statistics is easy. However we need a system that can simulate a real time scenario, so that the actual capacity or response time of the BI systems can be estimated. A system that performs quiet well for a single user coulf fail, when 100 such users access the system at the same time. In this article we will see how to quickly set up a performance test for your web reports and dashboards. We will use Jmeter an open source graphical testing tool

Jmeter setup:-

I have shows below the minimal settings that you will need to stress test your system. You can follow the documentation for advanced settings.

  • Provide a test plan name.


  • Add Thread Group.


  • Add HTTP Sampler. This is where you define the hostname, port and the url to test.


Once you provide the hostname, proptocol, and port, you need to add the path for report / document execution. Add the login credentials to the URL, eg:- &uid=username&pwd=password

This is needed for automatic login and execute the report. Remember to set your login method to standard during the time of test.

Now to view the results, use any of the listener outputs. like summarised view, tree view. I am using view results in table. You are now set to do the test. Lets look at the output.


The average response time is about 597 ms . Enable statistics from your web admin page and see the results.


Is shows 500 ms. So with this test data, you can say that the reports average response time is about 600 sec, with a deviation of about 140 ms for 10 concurrent access.


MicroStrategy - Disastar Recovery


MicroStrategy - Disastar Recovery

MicroStrategy provides clustering mechanism for HA. But that does not safegaurd your BI system. And it always need some additional care to make sure your BI system is available or at least you can recover the system to a stable state in a short period of time.  This is quiet a generic statement, the "short time" depends on your business decision, its can be half an hour to days.. How critical is it to have this system back online, is also another business question you should consider beforing planning an disaster recovery.  You will however need to adopt additional process to safe gaurd your system.

How do we get started :-

You will fist need to identify the failure points. And then take appropriate measures to handle those situations. This is the findemental of a disastar recovery plan.

Possible failure points:-

  • Intelligence Server
  • Web Server
  • Network
  • Database (WH)
  • Database (MetaData)
You can generally classify service failure into two 1. System Failure, 2. Software failure.  The procedures to follow for these two kinds of failure are different. In case of a hardware failure, you are will need to find a new hardware and restore your system, where as in case of software failure you will need to start troubleshooting and initiate recovery process.

Hardware Failure :-

If your hard disk is good, you can find an alternate server and swap the hard disk. However if the hard disk has failed, then you will need to rebuild the system. Rebuilding a system is a major process and almost all companies have some standard way of doing it. Some might use PXE boot and other might even have a even more simple process like doing an update on a web page.

The fastest way to restore your Intelligence Server is to  archive the Microstrategy folders, Cache folder, and your Inbox (history list), tnsnames.ora, third party library (if you use)  and then untar it on the new system. That will need you keep a latest copy of the files in an archive format. You can use tar command in linux for doing that.

The same goes principle goes for your web server, if you are using apache tomcat.  Just keep a archive of the apache install directory. Untar it on the new system and you are ready to go. Provided you have dependecies like java installed on the new system. The other dependencies like java will be installed as part of OS reimage. Hence you dont need to take backup of these binaries in your archive.

The process to restore the system is simple and easy, Ofcourse if you have planned for it.

Restore Process :-

  • IServer
    • backup the following directories using tar
      • MSTR installation directory
      • Cache and Inbox
      • tnsnames.ora referenced in your odbc.ini file
  • Web Server (apache tomcat)
    • Backup the entire install directory  excluding the workdir and logs
  • Reimage a new hardware with the same OS image used for IS and Web server
  • Copy the archive files to the new server and untar it.
  • If you are just replacing the broken hardware with the newer one, this is all you will need to do.
  • In case if you moving to a new system, and there is change in hostname, you will need to reconfigure the web and other changes might be needed.

Software Failure:-

Here you have an option to migrate the services to another server. This concept is called cluster. MSTR supports clustering of upto four Intelligence Server.  You can configure the cluster to work as load balancing or for high availability. MSTR will take care of migrating the project to another server in case one node fails.

Generally production environment is built like this. Iservers run on linux, and web servers run on apache tomcat on a linux system. You can either cluster two tomcat server. Or run them as independent server and add a vip and load balance using the load balancer. The load balancer will detect if there is a server failure and reroute the request to the other node.

Colo Failure:-

How do we safegaurd from a colo failure. It's not extremely rare to see a colo outage, imagine if the backbone and backup backbone for outgoing connection fails, your colo is unaccessible. The way to safegaurd from such a failure is totally different from the above two scenarios. You need to have greater budget, since it not only involves building a replica of the BI systems, but also your data warehouse. Remember all your data is coming from the WH and if the WH is residing in the colo which is considered as failed.

Build a similar system in the backup location and let it be online. If your BI URL is x.company.com, you can name your backup BI as xbackup.company.com. Make sure your backup BI is working fine. Now the most important factor is , dont let users know about the backup URL. Secondly apply all the productin changes to backup systesm, like hotfix, plugin, configuration changes etc. When the primary fails, just make a DNS change and point your primary URL to the backup. Users might see a small lag due to colo change, but thats usually negligable. You can create your own system to monitor the primary url and do this failover automatic. You can include your business rules on when to do a failover and how many reattempts to make before you do a  failover.

Saturday, May 4, 2013

Sorting on an alphanumeric metric column

How does microstrategy sort data ?

This looks like a very easy question, however it is important to understand how sorting of data happens in the report.  With Version 9.x MSTR has changed the way they sort data. Earlier the sorting was platform dependent. Intelligence Server will do the sorting for a 4-tier environment (web) and the desktop analytical engine will do the sorting for 3-tier architecture. The sorting is dependent on the platform (OS) specific localization setting to determine the sorting rules to follow. However rules for the same localization on different platforms are different and this often affected the sort order for MicroStrategy Reports. To mitigate this problem, starting from 9.x MSTR uses International Components for Unicode libraries for sorting algorithm. This library is standard across all platforms. 

Alphanumeric sorting 

This is based on "natural sorting" algorithm. You need not be surprised when you see A100 coming before A20.  Micorstrategy identifies the type of data returned from the warehouse, and and applies similar sorting logic. There might be lot of instanced when your metric consists of both Alphabets and numbers. How do you sort it ? And then you sort on such metric, the results will look like below.

Why is 10 coming ahead of 2. This is not users want to  see. Users dont care what damn algorithm you use for sorting. All they want  to see is data sorted in a humanly sensible way, and that is numer 10 coming after number 5. If it is a programming language you could write your own code. Will you be able to do a code change for BI internals ? Or do you have the time to request for a new algorithm and wait for it? Usually you get few hours to respond for a client request like this?

There are multiple ways you can resolve this problem. You could alter the table structure and insert a new numeric column, and sort on that. It is nearly impossible to apply this solution in a productin environment to solve a problem like this.
The easy way is to create a new fact, with your database specific function to convert the column into integer. I am using microsoft access DB and below is the new fact expression that I created.

ApplySimple("cint (#0)", [TEST_SORT])

This database specific function would take care of converting the column values into numeric type and return only numberic data.  Sorting on the numeric data type is what the user expected to see. You can create a new metric based on this fact and sort using that. You will now see the report results sorted in a way the user wanted. 

You can apply formatting and adjust the column width if you do not want to display the new metric in the report. Will look like something below.


Do you know of any solution where you can add the new metric in the objects list and sort based on that. I am using 9.2.1m and when I applied advanced sort based on this new metric and removed it from the grid, the sorting was reset. It there is a way you can sort on objects not in the grid, that could help .

Friday, May 3, 2013

Web or Intelligence Server - Identify where to start applying the optimization


Perfronamce Optimization

Invariably this is one area where every architect and developer will spend a lot of time identifying the bottleneck in the system or the whcih areas to apply optimization.  How do they do that ? We do not  know the internals of MSTR, and the only approach that we can take is to follow the suggestions provided by MSTR. And there are many. Before you start following the suggestions you must know which of these sugegstions to apply? Else you will end up in lot of trials than what is necessary and many times, tasks that can be completed quickly, could take longer time.

So how do i quickly identify where to apply the optimization ?

  1. Is it my web server taking longer time to display the result?
  2. Is it my Intelligence Server taking longer time to process the result ?
  3. Is it my network causing the delay ?
these are the basic questions you could start asking and once you identify the source of delay, you can further use the suggestions from MicroStrategy.

Web Stats

MicroStrategy has an option in the Web Admin Page, called statistics. You can enable this and choose either screen / file / both. When you choose screen option, you will see some statistics on evey page displayed. Lets look at how to use these statistics.  For the purpose of the demo, I created a Dashboard with three reports. I have disabled report caching at project level, since I dont want the results to come from a cache while doing my testing.

On Executing the dashboard, you can see the below statistics displayed below the dashbaord content.

Total Web Server + IServer processing time : 3140 millisecondsWeb server processing time : 630 milliseconds (20%)
Transmission Time : 0 milliseconds
IServer processing Time : 2510 milliseconds (80%)
   IServer API time : 220 milliseconds (7%)
   IServer polling time : 2290 milliseconds (73%)
Number of Web API polling calls : 22
Number of Web API calls : 27
Bytes sent/received : 31504 63643
Start Time (millis) : 1367477655056
End Time (millis) : 1367477658196
 

Lets look at each of these lines.

  1. the first line, tells me that the total time it took for the display of the dashbaord is approximately 3 sec
  2. second line, shows the total time taken by web server, this is the renderind time web server takes to process the xml results from the IS  (630/3140) *100 = 20 %
  3. third line, is the transmission time, since IS and web are on the same machine, it is zero
  4. fourth line, shows the time taken by the Intelligence Server for processing of the results as well as the polling time. (2510/3140) * 100 = 80 %
  5. fifth line, shows the time to execute XML API calls and retrieve the data.
  6. sixth line , shows the amount of time the server spends polling the IS for data.
  7. seventh line, show the number of polling calls made, polling is done every 110 milliseconds.
  8. eight line, shows the number of API calls made by web, this included calls to IS and local calls to acccess cache, user rights etc
  9. ninth lines, shows the data send and received in bytes, it cal vary each time because of the number of calls made.
  10. tenth line, shows the start time
  11. elevent line show the end time.

So in this example, you can easily say that 80% of the time is spend in Intelligence Server.  So where should I start applying the optimization ? Web server ? but that hardly took 20 % of the time.   I need to look at how to optimize that 80%  time taken by I server.  

The reports are not using any prompts, and hence I decided to enable caching for them. Lets look at the stats now.

Total Web Server + IServer processing time : 860 millisecondsWeb server processing time : 450 milliseconds (52%)
Transmission Time : 0 milliseconds
IServer processing Time : 410 milliseconds (48%)
   IServer API time : 110 milliseconds (13%)
   IServer polling time : 300 milliseconds (35%)
Number of Web API polling calls : 3
Number of Web API calls : 14
Bytes sent/received : 7646 71394
Start Time (millis) : 1367477719529
End Time (millis) : 1367477720389
See how the dashbaord is now displayed withing a second. From three seconds to one second, is my performance gain. And all of this is done quickly. Depending on your case, the time it takes to find a method for optimization might vary.  The critical factor is to identify where to apply the optimization and which areas needs optimization. Without knowing that you are going to take a longer route for an easy solution.