Wednesday, June 26, 2013

Subtotal From Base


Lets look at this report. This report has a metric defined as distinct count of subcategory. Do you find anything strange in this report ?


Yes, the grand total is 24 and not the sum 24 for three years. (72) . Here the count is a distinct records and is defined as Count(Subcategory){~+}

The subcategory for each of the Category have not changed in 3 years. Hence the count of distinct subcategory is 24. Finding a total for distinct count was not possible untill MicroStrategy version 9.3. With version 9.3 this is possible by a new feature called subtotal from base. You have to create this from the web as a derived metric by right click on an attribute. 

The distinct values cannot be reaggregated to higher levels, you have to aggregate it from the base level to get the correct count of distinct values. When used in a view report, the Cube Subsetting Instruction Engine generates the appropriate sql to calculate this distint count from the base level.

However you will not see the distinct count when you use a derived element. This is becase the derived element is calculated by analytical engine and it runs after CSI engine. Hence the data will be wrong, since analytical engine is not re aggregating using the base values. So instead of displaying wrong number, mstr would show "--" .  For example your report will look like below with derived element.


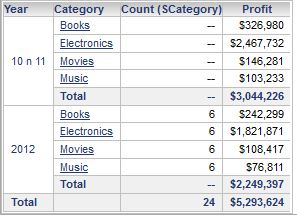
You will see similar results when you apply a metric limit, this is also because the metric limit is applied by the analutical engine after the CSI engine execution. 

VLDB Settings For Temporary Tables


Temporary tables are needed by MicroStrategy to store intermediate data.  You can choose the table type and kind using the VLDB properties.

Derived Tables

This is a nested select statement, and it does not physically exist. It is created during the execution of the sql and it utilize the database memory for creating this virtual table.  This makes use of the database memory, and you will need to check the performance by testing both types.

The syntax is like select a,b from (select c,d from table)

You might have noticed that certain reports cannot be resolved by the use of subquery in derived tables. These reports include the following.
  1. Creation of datamarts
  2. Query partitioned tables
  3. Reports with Custom Groups
  4. Reports with Percentage Ranking
  5. Reoprts with analytical functions supported by MicroStrategy Analytical Engine and not the Database

Common Table Expression

example SQL .

with TEMP1 as
(select a21.STORE_NBR STORE_NBR,
(sum(a21.REG_SLS_DLR) + sum(a21.PML_SLS_DLR)) TOT_SLS_STR,
sum(a21.PML_SLS_DLR) PRO_STR
from STORE_DIVISION a21
where a21.STORE_NBR = 1
group by a21.STORE_NBR),
TEMP2 as
(select a22.REGION_NBR REGION_NBR, ............

The advantage here is that you can create the temp table once and refer it multiple times.

You can change the table type using the VLDB Property ->  Tables -> Intermediate Table Type .

Implicit Table creation Vs. Explicit Table creation.

Example of Implicit table creation
create table TEMP1 as
select a21.STORE_NBR STORE_NBR,
(sum(a21.REG_SLS_DLR) + sum(a21.PML_SLS_DLR)) TOT_SLS,
sum(a21.PML_SLS_DLR) PROMO_SLS
from STORE_DIVISION a21
where a21.STORE_NBR = 1
group by a21.STORE_NBR

Example of Explicit table creation
create table TEMP1 (
STORE_NBR INTEGER,
TOT_SLS DOUBLE,
PROMO_SLS DOUBLE)
insert into TEMP1
select a21.STORE_NBR STORE_NBR,
(sum(a21.REG_SLS_DLR) + sum(a21.PML_SLS_DLR)) TOT_SLS,
sum(a21.PML_SLS_DLR) PROMO_SLS
from STORE_DIVISION a21
where a21.STORE_NBR = 1
group by a21.STORE_NBR


You need to test and find out which of these methods provides an optimal performance. Generally there is not much difference in the excution plan between these two types, (I have not lab tested this), however  according to Dr. Tim Hall   implicit cursor is kind of faster.

You can access this setting at VLDB ->  Tables -> Table Creation Type

Another setting you might be interested to check would be "Drop Temp Table Method" . Certain cases when you use global temporary tables on Oracle, the tables need to be empty before you can drop it. Otherwise oracle will throw error.

MicroChart


Its is just a quick reference to build the microchart. I just copied the contentd from the help page.

To display all three microcharts, place at least seven metrics on the Grid/Graph’s columns.

The first (left-most) metric on the columns determines the height of the bars in the bar microcharts and the peak points in the sparkline microcharts.

The second metric creates the horizontal reference lines that are displayed in the sparkline microcharts.

The third metric determines the length of the performance measure bar in the bullet microcharts. The bar represents the actual metric value.

The fourth metric determines the maximum possible values in the bullet microcharts.

The fifth metric determines the right-most boundary of the first color band, Band 1, in the bullet microcharts.

The sixth metric determines the right-most boundary of the second color band, Band 2, in the bullet microcharts.

The seventh metric determines the value of the vertical reference line in the bullet microcharts, which is typically the target value for the metric.

Any additional metrics are displayed in the columns of the widget, after the microcharts and their associated metrics.

For KPI List mode, you must place at least one metric on the Grid/Graph's columns.
By default, each metric is calculated and displayed as an individual row in the widget.

To display all three microcharts (bar, sparkline, and bullet), you must place a total of at least seven metrics on the columns as described above. You must also set the number of metrics used to calculate each row in the Metrics per KPI field to seven or greater in the Microchart properties dialog box.
 

Concatenate Two Attribute Forms


You can create a new derived metric from an existing metric in the grid. And you can use many of the available function in the derived metric editor. Ist is possible to concatenate two attribute forms using derived metric.  Derived metrics will by default show only the metrics available in the grid.

For example. I have a rerport with the below attributes.


However I need to display the combination of  two attributes forms as below.ie. ID of category and DESC of subcategory.


You can use concat function to join multiple strings. So you need to convert the attribute form into derived metric and then use the concat function. How do we do this ? You can use MAX function to convert the atribute form into a derived metric, so that concat function can recognise the string.  So inset a new metric with the below formulae.

Concat(Max(Category){~}," . ",Max(Subcategory@DESC){~})

This is concatenating the ID form from category with a space dot and decriton form from subcategory.

Now, in my report I am showing all these three columns, ie category, subcategory and categotyID . SubcategoryDESC. How do I display only the concatenated attribute? If I remove the other two attributes from the grid, the derived metric will be empty. Do you have any suggestions other than modifying the width of the the attributes ? Please do let me know.


Microstrategy Project Default Homepage

At my previous project, we had a requirement to showcase a dashboard on a TV. It used a specific username and we did not want to go through shared folder for accessing the dashboard every time we login. So we had to make this dashbaord a default home page. You might be familiar in setting this in Mobile config. However you can do that in web also.

  1. execute the document you want to set up as the default page.
  2. click on the mstrLogo (red star image on top left) and choose preference.
  3. In user preference - > general you will see an option to set up the last executed document / report as the default start page.
  4. So next time you only need to login and you will see your dashbaord executed.

Thursday, June 20, 2013

Passing Prompt Answers in URL


At least couple of times in your project, you might have come across a situation where you need to share a view of your dashbaord or report, based on the prompts that you selected. Fortunately, MicroStrategy supports and provide a way to pass the prompt answers in the URL, So that you can generate the URL and share it with other or you can even use it for stress testing. 

There are few types of Prompts and the parameter for each of these are different.

Prompt Type                                      Parameter
Element list Prompt                              elementsPromptAnswers

Value Prompt                                      valuePromptAnswers

Object Prompt                                    objectsPromptAnswers


Unfortunately i did not see a method for passing  a level prompt in the URL 

Now that we know the parameter for different prompts, lets see how to pass values to these prompts.

  • elementsPromptAnswers
    • AttributeID;AttributeElementID^DisplayName is the formart
    • AttributeID;AttributeElementID^DisplayName;AttributeElementID^DisplayName  --. when you have multiple answer for a prompt. 
    • AttributeID;AttributeElementID^DisplayName;AttributeElementID^DisplayName,AttributeID;AttributeElementID^DisplayName when you have multiple prompts.
  • valuePromptAnswers
    •  Unlike the element prompt, here there is no option to refer to the attribute. Hence the order in which you give the prompt answers will impact the results. If one of the answer is empty, you need to properly delimit that.
    • user carat "^" for delimitation. eg: Books^2013^India . If you dont answer 2013, the format will be Books^^India
  • objectsPromptAnswers
    • The name in the below format is optinal, but without that you will not be able to refer to the prompt in the document. Also since the prompt answers do not have identifiers to map then to prompts, the order in which the prompt is answered is important. 
    • objectID~type~name is the format 
    • objectID1b~type1b~name1b^objectID2a~type2a~name2a  -> multiple objects prompts answered.
    • objectID1a~type1a~name1a%1BobjectID1b~type1b~name1b  -> passing multiple objects in one prompt.
You can find the objectID either from the metadata or more easily from the desktop. Right click and check the property.

Now lets look at constructing the URL.

For a Dashboard, URL is

http://Localhost:8080/MicroStrategy/servlet/mstrWeb?

evt=2048001
&src=mstrWeb.2048001
&documentID=
&ViewMedia=2
&elementsPromptAnswers=

For a Report, URL is
http://localhost:8080/MicroStrategy/servlet/mstrWeb?

&src=mstrWeb.4001
&evt=4001
&reportID=
&elementsPromptAnswers=

Notice the highlighted changes in event number and document / report ID.

Lets look at an example. I have a document with a report, and it has all the below types of prompts. It has object prompt, element prompt. 
Objects          -> attr - category / brand / call center
                      -> metric - profit / revenue
elmemt list      -> limited on the year

How do I add the elments and objects to the url  ? We can follow the method described above. But it becomes tedious and error prone when the number of elements and objects increase. What is the best way to create the url in this case ?

Fortunately, MSTR also supports passing prompts as XML. Now how do we generate an XML. It is Quiet easy.  Just place a dynamic text box in your document for {&PROMPTXML} .


Execute your document and you will see the XML.


You can now insert the xml using the parameter promptsAnswerXML in the URL.


Wednesday, June 5, 2013

9.3 Parallel Query Execution


9.3 Supports parallel SQL execution from reports. 


There is another setting with database instance manager where you can set the maximum number of parallel execution of sql, this is for sql from different reports. you will need this while executing a document.  We are here looking at executing the sql from a single report in parallel.

You can enable / disable this through the VLDB settings. Go to VLDB - Tools - Show Advanced Options.  In Query optimization, you can find the below two properties.


The second one can help you get an estimation on the time that can be saved with parallel execution. This information will be shown in the report SQL.

for example.

WITHOUT PARALLEL EXECUTION
Query Generation Time: 0:00:00.26

Total Elapsed Time in Query Engine: 0:04:17.49
Sum of Query Execution Time: 0:04:13.07
Sum of Data Fetching and Processing Time: 0:00:00.05
Sum of Data Transfer from Datasource(s) Time: 0:00:00.05
Sum of Analytical Processing Time: 0:00:00.00
Sum of Other Processing Time: 0:00:04.37
Projected execution time improvement (%) if executed in Parallel Execution mode: 97%

This report that took about four minutes to run, can be improved upto 97% using PSE. (Parallel SQL Execution)   WITH PARALLEL EXECUTION Query Generation Time: 0:00:00.30
Total Elapsed Time in Query Engine*: 0:02:42.19
Sum of Query Execution Time: 0:05:12.80
Sum of Data Fetching and Processing Time: 0:00:00.01
Sum of Data Transfer from Datasource(s) Time: 0:00:00.01
Sum of Analytical Processing Time: 0:00:00.00
Sum of Other Processing Time: 0:01:47.28

* This report has some passes that have been executed in parallel. Individual time components may not add up to Total Elapsed Time in Query Engine.

I can see that this report not runs at 63% of the time it took earlier withouit PSE. But why did not I get 97% improvement ? You can configure the number of PSE for your report from Project Configuration - Advanced - VLDB setting - Query Optimization.  By default it is 2. Ie two sql pass will run in parallel. Try playing with this number and see what is the best value for your report.   In my case, I had about 206 SQL pass, and when set PSE to 3, I started getting errors, may be the SQL pass was fired too fast, even before the DB commited the table from the previous passes.   This is a project wide setting. In your project, if you have 5 reports and each of them have a different optimal number for PSE, you need to choose the lowest PSE for your project. By optimal PSE settig I am refereing to the max PSE you can choose, before the report starts failing. (too fast - just like some movie heros shoot the enemy faster than their own shadows :-) ) .